Benchmarking synchronous and asynchronous logging
Log4j 1.2 as well as logback have supported asynchronous
logging for many years by the way of
AsyncAppender. This appender essentially collects
newly created logging events, as produced by the application,
into a circular buffer. The events in this circular buffer are
then processed by a dedicated worker thread which writes the
events to their destination, be it a file, a remote server or a
database.
Thus, from the application's point of view, the cost of logging is reduced to placing a logging event in a buffer local to the JVM. Such a handing-off operation can be performed with a throughput in the ballpark of roughly 1'000'000 operations per second or a service duration of a microsecond per operation. If the destination of the event is a database with a throughput of 200 operations per second, the performance gain can be tremendous. This very favorable situation occurs if the rate of logging event arrival is slower than the rate of service, that is the rate at which events are transmitted to destination and taken off the circular buffer.
Asynchronous logging is not a panacea however. It still has
to obey they laws of the physical universe. In particular, in
case the rate of arrival of logging events is consistently
higher than the rate at which the events can be written to
destination, the circular buffer within
AsyncAppender will eventually become full, as
infinite sized buffers do not exist in our universe, and the
application will be able to hand off events to
AsyncAppender's buffer only at the rate the events
are actually written to destination. This is an essential
limitation of asynchronous logging and all queued/buffered
systems in general. By the way, computers can be viewed as a
system of queues.
Here is a more concrete example: suppose for a given hardware
configuration FileAppender can write to disk at the
rate of 100'000 events per second, that is with a duration of 10
microseconds per event written, then, if your application logs
101'000 events per second, then the throughput observed by your
application will be 100'000 events written per
second. AsyncAppender's buffer will not be able to compensate
for arrival of the extra 1000 events per second. We say that the
AsyncAppender is overloaded by the arrival rate of
logging events.
When the AsyncAppender is overloaded, your
application will be paying the cost of moving events in and out
of AsyncAppender's circular buffer in addition to
sending events to destination. Thus, when we talk about
asynchronous logging performance, we need to consider the
performance of logging when the AsyncAppender is
overloaded. A second consideration is whether asynchronous
logging buckles under the pressure of many producer threads all
contending for AsyncAppender's circular buffer.
As mentioned earlier, if the rate of event arrival is slower than the service rate, the application will only have to hand-off logging events to a circular buffer, significantly lowering the perceived cost of logging. At the same time, we must also consider the worst-case scenario where the rate of logging event arrival is higher than the service rate. Such a scenario is not that uncommon as slow appenders abound. Therefore, as a worst-case analysis, an asynchronous logging benchmark should yield information about the overhead of asynchronous logging (when overloaded) and its behavior in presence of many producer threads.
We have chosen to use FileAppender in
conjunction with AsyncAppender. Not only is
FileAppender the most often used appender, it is
fast enough so that differences in asynchronous logging
overhead can be noticeable. Had we used DBAppender,
all asynchronous implementations would have the same performance
with little or no noticeable differences.
Comparing log4j, log4j2 and logback
The source code for the benchmarks can be found in the logback-perf github repository. We compare the performance of log4j version 1.2.17, log4j 2.14.1 and logback 1.3.0-alpha10.
We have taken care to compare apples to apples. All tests
specify the same buffer size, i.e. 256KB, for all
FileAppender instances across frameworks and using
the same identical pattern, that is "%d %p
[%t] %c - %m%n". Lossy behavior (when the buffer is
full) is turned off for logback's AsyncAppender. It
is turned off by default for log4j 1.2 as well as log4j2.
Regarding the circular buffer size for
AsyncAppender or log4j's LMAX ring buffer, we have
chosen to leave the default values as is. By default, log4j 1.2
uses a circular buffer size of 128, log4j2 ring buffer is set to
262'144 by default and logback is set to a buffer size of
256. In principle, the much larger ring buffer should favor
log4j2.
Below are the benchmark figures when ran under Windows 10, JDK 16, Intel i7-6770HQ CPU and an WDC NVMe WDS512G1XOC hard disk with an advertised (and actual) 800MB/sec sequential write throughput.
| Threads | log4j synchronous | log4j asynchronous | log4j2 synchronous | log4j2 asynchronous | logback 1.3.0 synchronous | logback 1.3.0 asynchronous | Unit |
|---|---|---|---|---|---|---|---|
| 1 | 987.08 | 745.34 | 884.33 | 844.67 | 2,139.83 | 1,760.30 | ops/ms |
| 2 | 542.27 | 716.09 | 1,220.76 | 819.40 | 2,276.77 | 1,821.36 | ops/ms |
| 4 | 639.86 | 676.35 | 1,406.60 | 770.27 | 1,836.99 | 1,799.39 | ops/ms |
| 8 | 633.13 | 726.21 | 1,257.63 | 733.25 | 1,787.62 | 1,774.99 | ops/ms |
| 16 | 585.13 | 693.74 | 1,211.31 | 722.34 | 1,813.09 | 1,815.10 | ops/ms |
| 32 | 643.85 | 657.08 | 1,203.27 | 704.08 | 1,782.81 | 1,751.21 | ops/ms |
| 64 | 576.67 | 696.21 | 1,236.37 | 726.15 | 1,740.27 | 1,644.81 | ops/ms |
Here is the table presented as a chart.
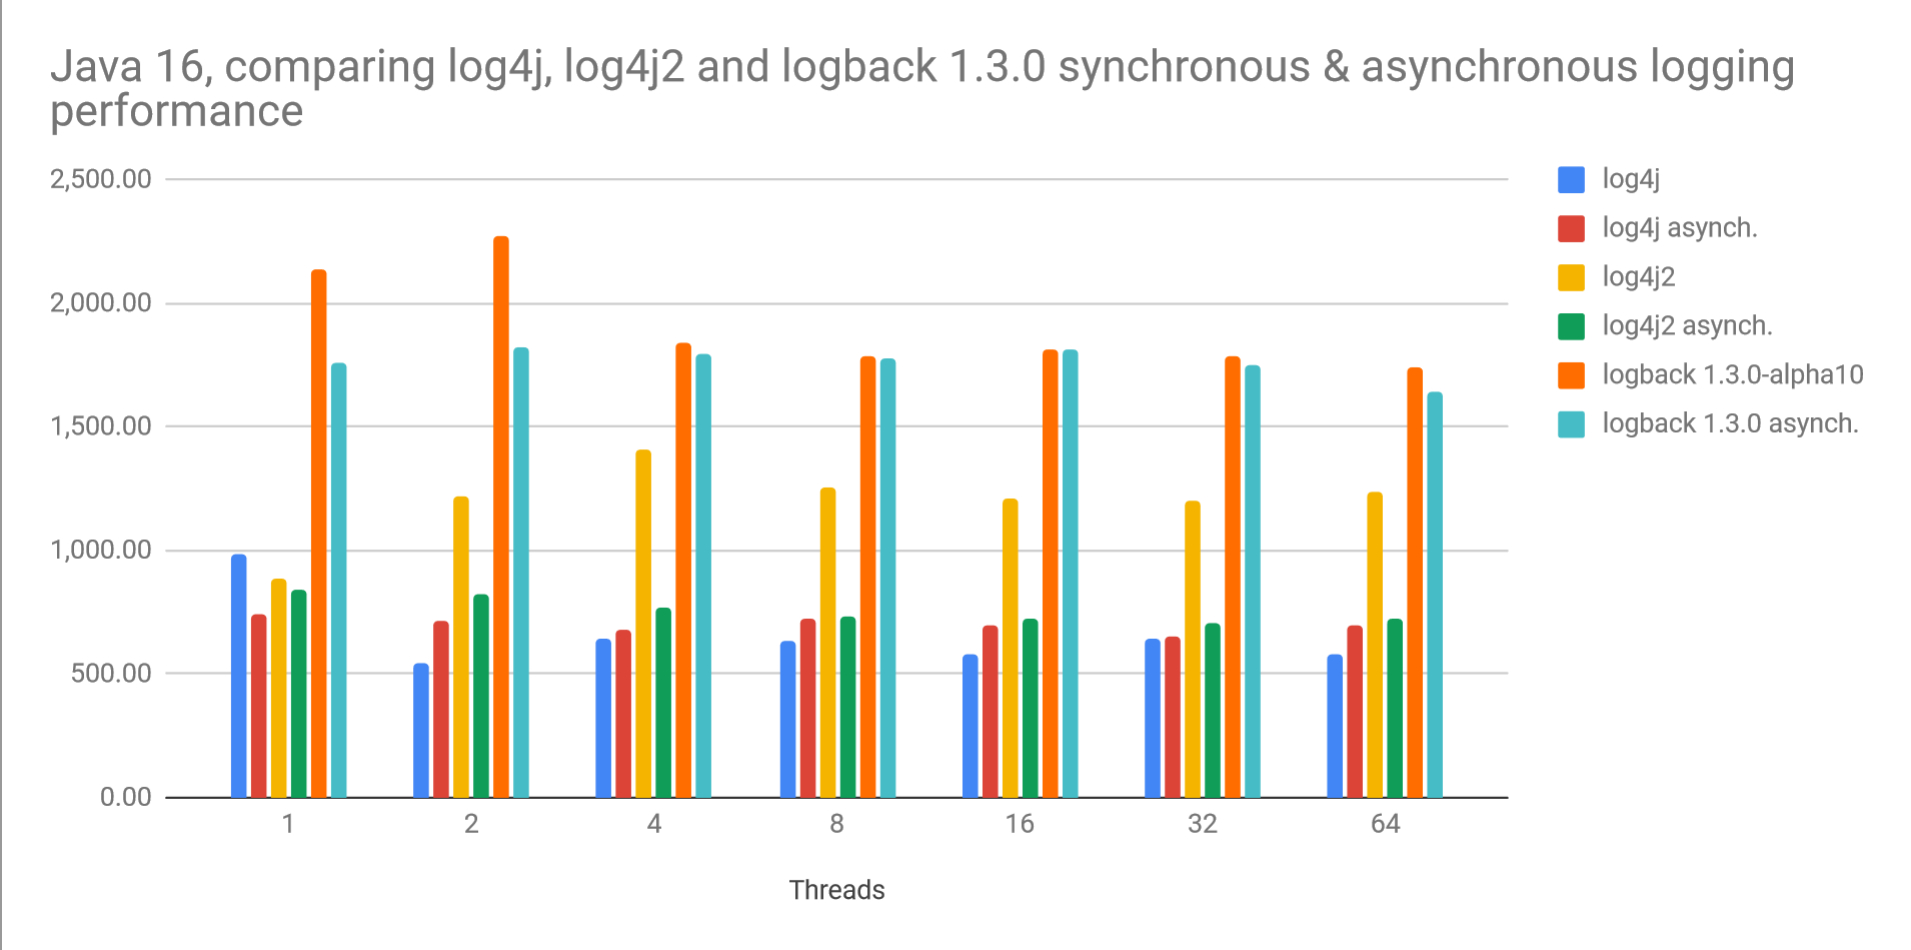
The above results show that throughput in synchronous logging is actually higher than that of asynchronous logging. This is true across frameworks. This result can be attributed to the fact that in case of a fast appender, the extra work involved in accessing an overloaded ring buffer can be significant. In case of log4j2, this extra work is as high as 70%.
Another interesting point is that throughput degrades as the number of producer threads increase. Fortunately, the degradation is usually within a few percentage points across frameworks.
logback version 1.3-alpha10 performs about 3 times faster than log4j and about 1.6 times faster than log4j2 in case of synchronous logging. For asynchronous logging, logback 1.3 performs 2.5 faster than log4j and 2.3 times faster than log4j2.
While these points may be somewhat subtle, the not so subtle observation is that logback version 1.3-alpha10 performs about 3 times faster than log4j and about 1.6 times faster than log4j2 in case of synchronous logging. For asynchronous logging, logback 1.3 performs 2.5 faster than log4j and 2.3 times faster than log4j2.
Note that with 2'200'000 events per second, and 209 bytes
written per event, logback's FileAppender is
generating output at 474 MB/sec, or at 59% of the hard drive's
throughput capacity of 800 MB/sec. If nothing else, this is
quite a testament for the performance of the JVM.
Given that logback uses off the shelf JDK components in contrast to log4j2 which uses the LMAX Disruptor, that is highly optimized code pervasively using 64-byte cache alignment, a.k.a. mechanical sympathy, the above results can be quite the surprise.
How can code optimized for CPU cache alignment be significantly slower than code which is supposedly less optimized?
While we do not have a definite answer, it is likely that algorithmic differences account for logback's better performance. Moreover, in a multicore CPU running many threads, concurrent access requires use of the shared L3 cache, perhaps mitigating the advantages of L1 and L2 caches.
Replication of results
The results have been replicated by the author on several other computers, including an Intel i7-8565U running Windows, an Intel Xeon E5-2650L running Linux under a KVM hypervisor and an AMD A10 Micro-6700T running Linux.