Logback-beagle
Logback-beagle: an Eclipse plug-in for viewing logs
During the development process, it is common for developers to print logging events on the console. Typically, the developer will also customize the format of the log output by setting an appropriate layout pattern. Logback-beagle is intended as a replacement for viewing logs via the console. It offers several advantages over the plain-old console:
- Events of level WARN and ERROR are marked by an orange flag and respectively a red flag.
- Quickly jump to the class and line where a given logging request originated
- Easily view and jump to the callers of any log statement up to eight levels deep
- Change the output format on-the-fly
- quickly filter-out events by setting the level of existing loggers
- Measure the time elapsed between any two lines of log
Plug-in Installation
The logback-beagle plug-in requires the Nebula Grid plug-in which must be installed first.
- Step 1: Nebula Grid
-
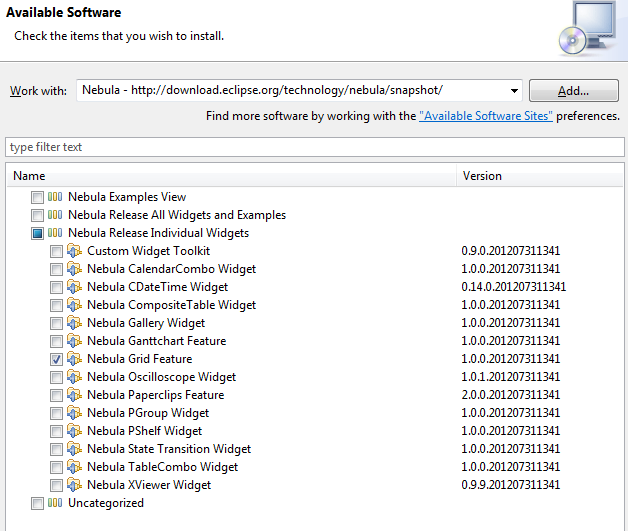
The Nebula Grid plug-in which can be installed from http://download.eclipse.org/technology/nebula/snapshot/. Only the "Nebula Grid Feature" needs to be installed.
- Step 2: Logback-beagle
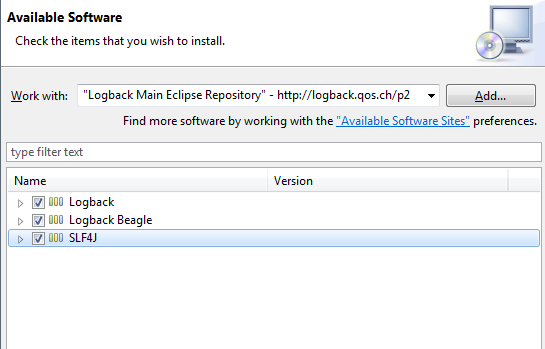
The logback-beagle plug-in can be installed from http://logback.qos.ch/p2/. You need to select "Logback", "Logback Beagle" and "SLF4J" bundles for installation as shown below.
Restarting Eclipse should load the plugin. To access the Beagle View, either type A"lt-Shift-Q, Q" or select: Window > Show view > Other... . You should see the Beagle view nested in the Logback category. Selecting this view will add it to your workspace. It should look as follows:

Configuring the client (logback.xml)
A single additional configuration line in logback.xml is sufficient to send log events from your application to logback-beagle.
<configuration debug="true">
  <!-- sends logs to logback-beagle -->
  <consolePlugin />
</configuration>
Under the hood, <consolePlugin> element creates
a SocketAppender which will send logging events to a
TCP socket on localhost port
4321. Logback-beagle launches the corresponding server
listening on this port on localhost.
Using logback-beagle
Logback-beagle displays the events it receives in a table according to the layout format chosen by the user. Here is a screenshot of the Beagle View containing logging events.
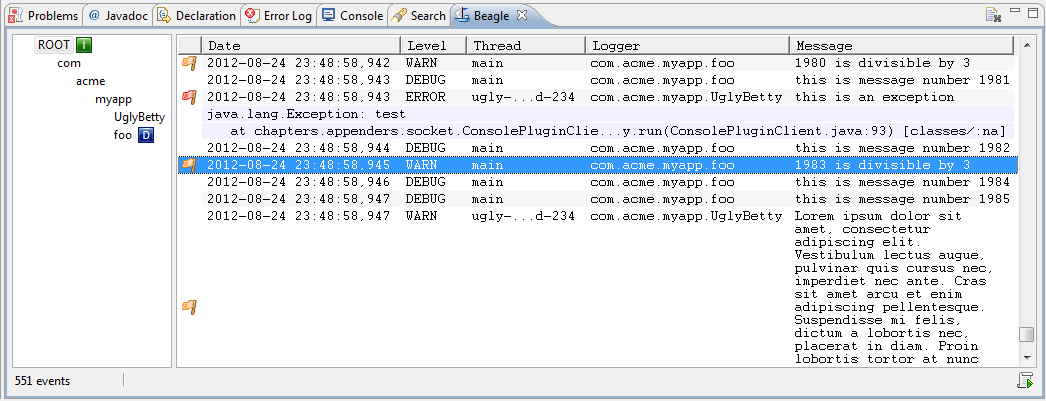
Clicking on any log line will scroll-lock (freeze) the
view. Double-clicking on that same line will release the scroll
lock (unfreeze) the view. You can also release the scroll lock by
clicking on  . This icon becomes active (clickable) when the view is
frozen.
Jump to caller/Expand caller data
Right-clicking on any line will reveal the following menu:

Selecting "Jump to caller" will move the edit cursor to the file and line number whence the logging statement issued.
Selecting "Expand caller data" will reveal the stack trace of method calls up to eight levels deep. Here is a sample screenshot:

Not only are the callers of the log statement revealed, it becomes possible to jump to any of the listed callers. Right-click on a caller line. A menu will appear. Select "Jump to caller" in the menu to jump to the caller of your choice.

Caller data can be collapsed by selecting "Collapse caller data" from the said menu.
Preferences
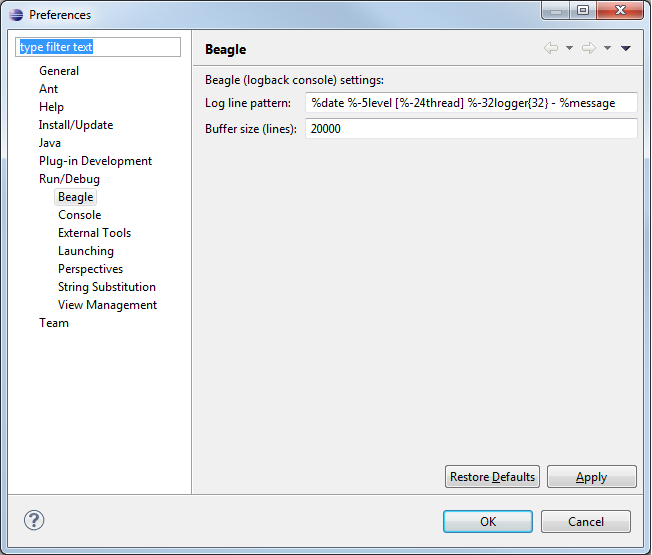
Logback-beagle preferences can be found under the "Beagle" label nested under "Run/Debug" category. You can customize the output pattern to best suit your preferences. Changes take effect immediately.
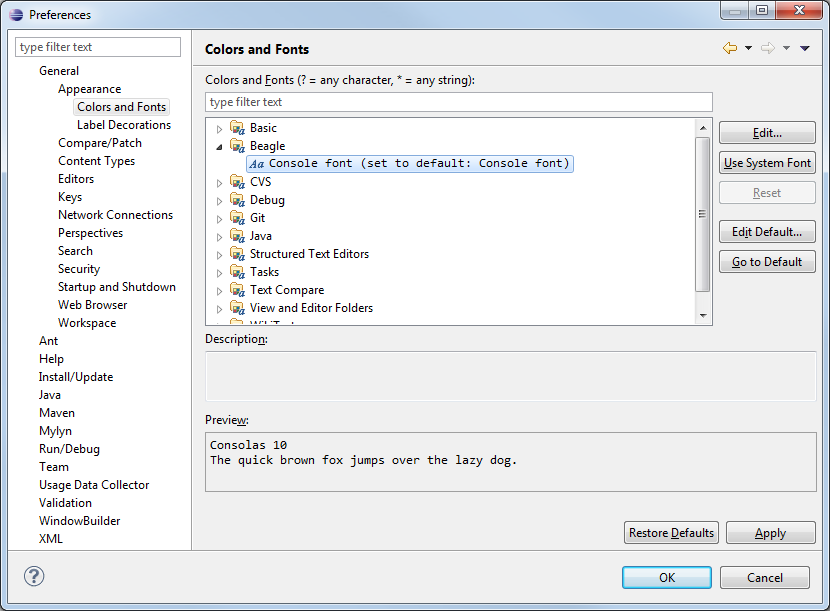
You may also change the font type and size used for displaying the log events via the Eclipse's preferences dialog as shown below:
